
Users can send diagnostic data for IT administrators to review. But what kind of data does it send, and where do you find it? As for now, I haven’t been able to find any official Microsoft documentation that describes the “Send Diagnostics” in the Experience monitor.
This article will go through the findings I made and how I use the data to do more efficient troubleshooting in Azure Virtual Desktop.
How can users send diagnostic data
When users are connected to an Azure Virtual Desktop session, they can click on the Experience monitor icon to check their connection quality.
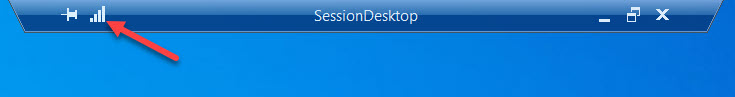
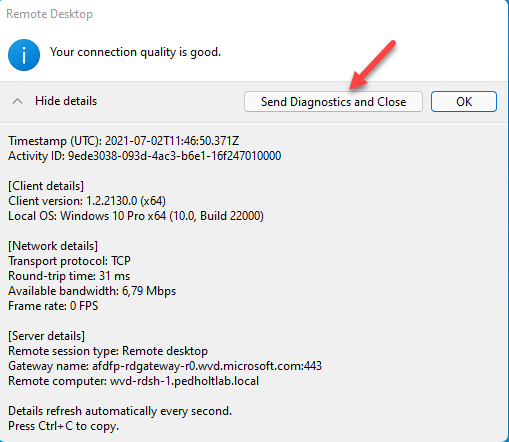
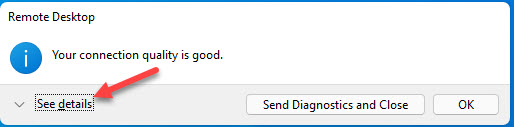
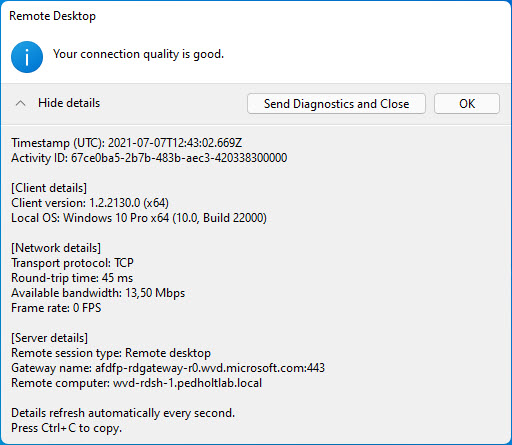
From here, they can either send diagnostic data for administrators to review, or they can see further details about their connection.
How to view the diagnostic data?
First of all, you’ll have to push diagnostic data from your Azure Virtual Desktop resources to a Log Analytics Workspace. Follow this guide if you haven’t already done it.
There are multiple data collections for Azure Virtual Desktop, the data from “Send Diagnostics” will be stored in WVDCheckpoints.
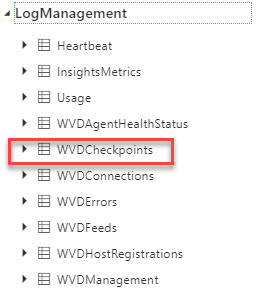
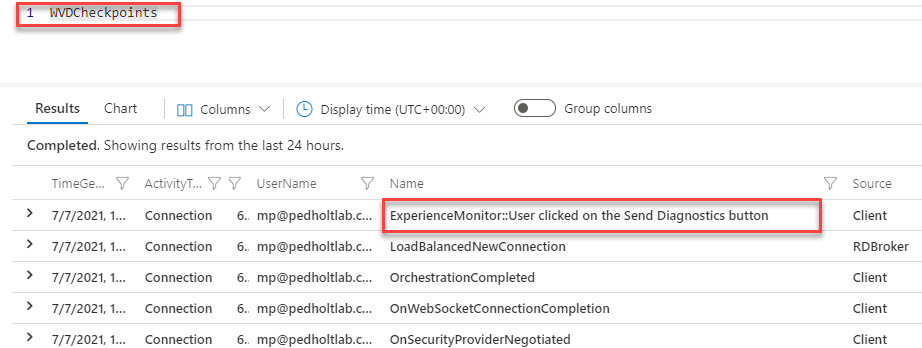
In the WVDCheckpoints, you’ll need to find a name called ExperienceMonitor::User clicked on the Send Diagnostics button. This is where you can find the diagnostic data.
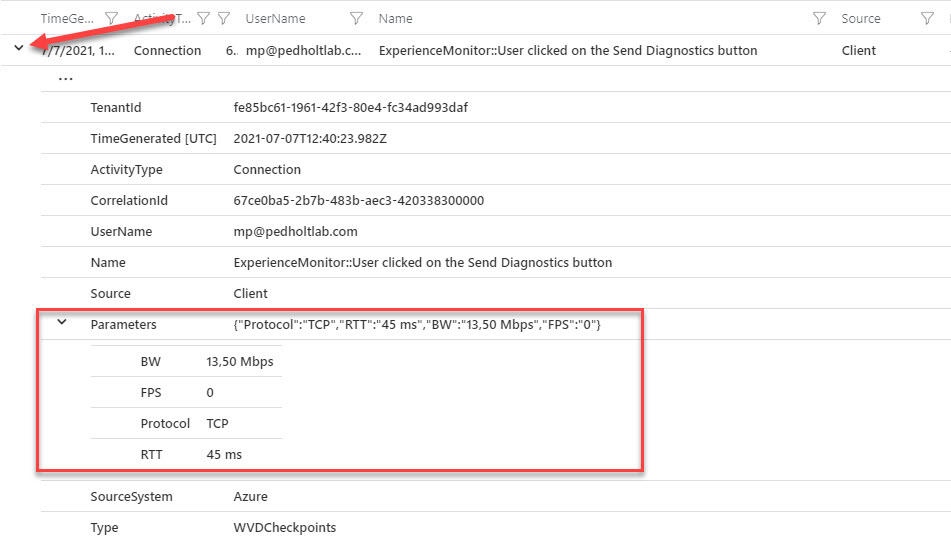
If you expand the log, you can see the Network details section from the Experience monitor.
Combine the diagnostic data with other log analytics data
Having the Network details from the users can be a huge help when troubleshooting. However, I found it more efficient to troubleshoot if I can see more information at once. Therefore I usually combine different logs to get a complete view of users’ sessions.
I have listed two examples below that I use when troubleshooting. Both examples will show the following columns:
TimeGenerated, CorrelationId, UserName, GatewayRegion, Network Details, ClientOS, ClientVersion, and SessionHostName.
View all session details for a specific user
This will get all sessions for a specific user within the selected time range. Fill out the upn parameter with a UserPrincipalName.
// Make sure to paste the UPN the "upn" variable
let upn = ""; // Example: let upn = "[email protected]";
WVDCheckpoints
| where UserName == upn
| where Name == "ExperienceMonitor::User clicked on the Send Diagnostics button"
| join (WVDConnections
    | where UserName == upn
    | where State == "Connected"
    | project ClientVersion, ClientOS, SessionHostName, GatewayRegion, CorrelationId)
    on CorrelationId
| project TimeGenerated, CorrelationId, UserName, GatewayRegion, Parameters, ClientOS, ClientVersion, SessionHostName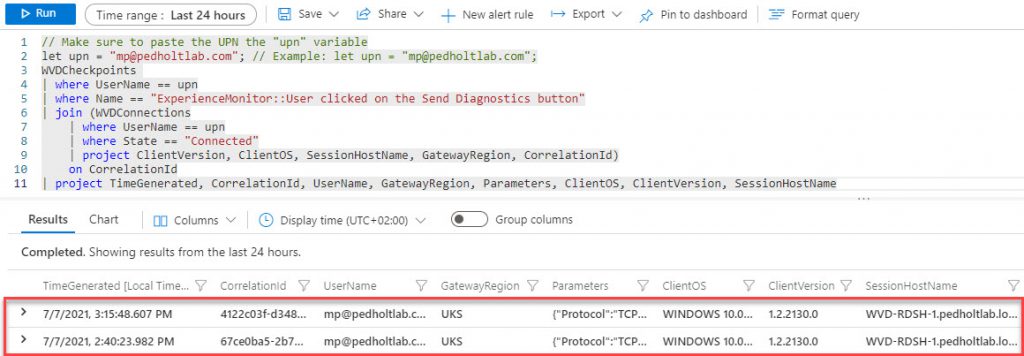
View details about a specific session
This query will return details for a specific user session. Fill out the UserSessionid parameter with a CorrelationId.
// Make sure to paste the CorrelationId in the "UserSessionId" variable
let UserSessionId = ""; //Example let UserSessionId = "4122c03f-d348-4264-8178-62e62d710000";
WVDCheckpoints
| where CorrelationId == UserSessionId
| where Name == "ExperienceMonitor::User clicked on the Send Diagnostics button"
| join (WVDConnections
    | where CorrelationId == UserSessionId
    | where State == "Connected"
    | project ClientVersion, ClientOS, SessionHostName, GatewayRegion, CorrelationId)
    on CorrelationId
| project TimeGenerated, CorrelationId, UserName, GatewayRegion, Parameters, ClientOS, ClientVersion, SessionHostName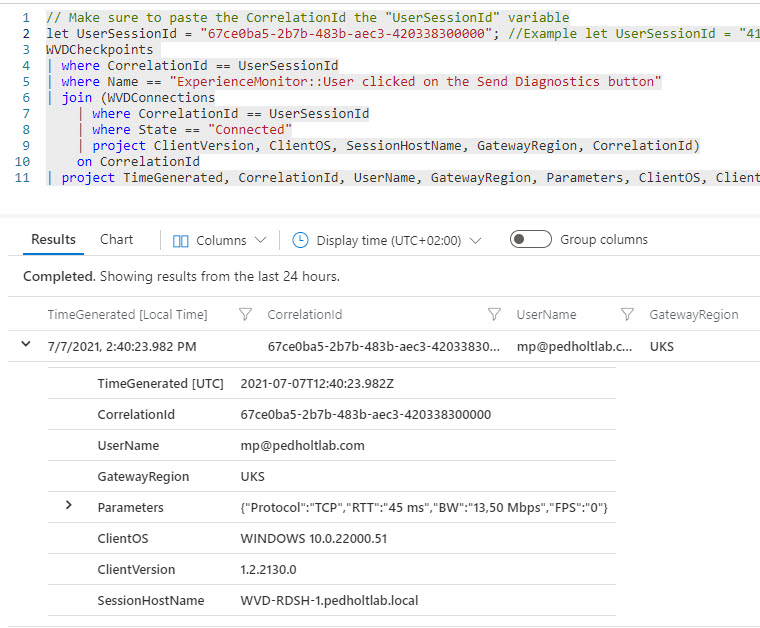
Final Thoughts
In the beginning, I didn’t know what kind of data was collected and where to find it. But after I found it in Log Analytics, I have used the data to troubleshoot more efficiently.
If you can find an official Microsoft article covering this part, feel free to post it in the comments below.
Pingback: WVD/AVD Weekly Blog Post 1st July – 8th July 2021 - WVD Community